 C1+C2+...).
We can estimate the probability of being open, Po,
as
C1+C2+...).
We can estimate the probability of being open, Po,
as Channels are specialized membrane proteins that let ions pass through at a
high rate when they are open. They are thought to have a specialized pathway
that allows the conduction of ions. This pathway may be open or closed depending
on the conformation of the channel molecule. Thermal motion will cycle the protein
between the closed and open conformations; consequently this transition is a
random event. This means that it is not possible to predict at any given time
whether the channel will be open or closed. The laws of probability, however,
allow us to make certain predictions of the average behaviour of the channel.
Thus, by observing the channel operation for a long period of time, we can compute
the total time the channel is open (O) as the sum of all the individual
openings (O = O1+O2+...)
and the total time the channel is closed (C) as the sum of the individual
closed times (C =
C1+C2+...).
We can estimate the probability of being open, Po,
as
Po= O/(O+C)
which is equivalent to the fractional open time.
In the type of channels that we are particularly interested, the Po is dependent on the membrane potential, thus they are called voltage-dependent channels. Na and K channels in neurons are voltage dependent and their open probability is low at negative (hyperpolarized) potentials and is high at positive (depolarized) potentials. The summation of a large population of these voltage dependent channels will produce a voltage dependent conductance in the cell membrane. Our approach will first be to understand the operation of the channels an then to explain the interaction between current and voltage across the axon.
The current through an open channel is very small, of the order of 10-12
Amps or pA. This is not surprising because it is the result of only one molecule
allowing the ions to go through. In fact, we may consider the ion channel like
an special "transducer" that allows us to detect its activity by recording
the single channel current. The patch clamp technique (Fig. 7) is used to perform
the single channel recordings and it is based on the isolation of a small area
of membrane with a glass pipette with a small aperture (about 1 µm diameter).
This pipette is sealed against the plasma membrane and when there is only one
channel in the area encompassed by the pipette, the current through that channel
can be recorded by a low noise amplifier (Fig. 7) while the membrane potential
(V in Fig. 7) is maintained constant. This technique allows us to measure the
flow of ions through one channel and calculate the actual open times O and
closed times C.
Several K channel genes have been cloned and sequenced, allowing the deduction
of the amino acid sequence of the protein. There are six membrane spanning
regions (see Fig. 8) and those regions have been identified with specific
functions of the channel. The actual channel is made of four subunits which
gives some symmetry to the molecule (see Fig. 8). Within the sequence of these
K channels, membrane spanning segment 4 (S4) contains a peculiar sequence of
5 to 8 positively charged amino acids that are repeated every three residues.
There is experimental evidence that this region is involved in sensing the membrane
voltage and therefore controlling the open probability of the channel. In the
series of figures of the Channel Operation of the web site (Plate 1) a
simplified and idealized view of the channel is presented whereby the S4 segments
are shown as cylinders that can move within the protein. The voltage across
the membrane will have an influence on this movement because this segment is
positively charged and we can speculate a possible mechanism for the control
of Po. We assume that when ANY of the four S4 segments are displaced
toward the inside (only 2 positive charges shown in each S4 segment) the pathway for ion
conduction is blocked. The only way to make it conductive is to move out and
rotate ALL
four S4 segments. In Plate 1, part E, this is shown for a depolarized potential
(+20 mV) allowing the ions to permeate. The actual permeation pathway is lined by segment S6 and
the loop between S5 and S6 and is represented by the green cylinders which are
coupled to the S4 segment trough a linker, so that when the S4 is tilted up
and straight ,
the corresponding region in the pore opens up. However, conduction will only
occur when ALL four open up.
protein. The voltage across
the membrane will have an influence on this movement because this segment is
positively charged and we can speculate a possible mechanism for the control
of Po. We assume that when ANY of the four S4 segments are displaced
toward the inside (only 2 positive charges shown in each S4 segment) the pathway for ion
conduction is blocked. The only way to make it conductive is to move out and
rotate ALL
four S4 segments. In Plate 1, part E, this is shown for a depolarized potential
(+20 mV) allowing the ions to permeate. The actual permeation pathway is lined by segment S6 and
the loop between S5 and S6 and is represented by the green cylinders which are
coupled to the S4 segment trough a linker, so that when the S4 is tilted up
and straight ,
the corresponding region in the pore opens up. However, conduction will only
occur when ALL four open up.
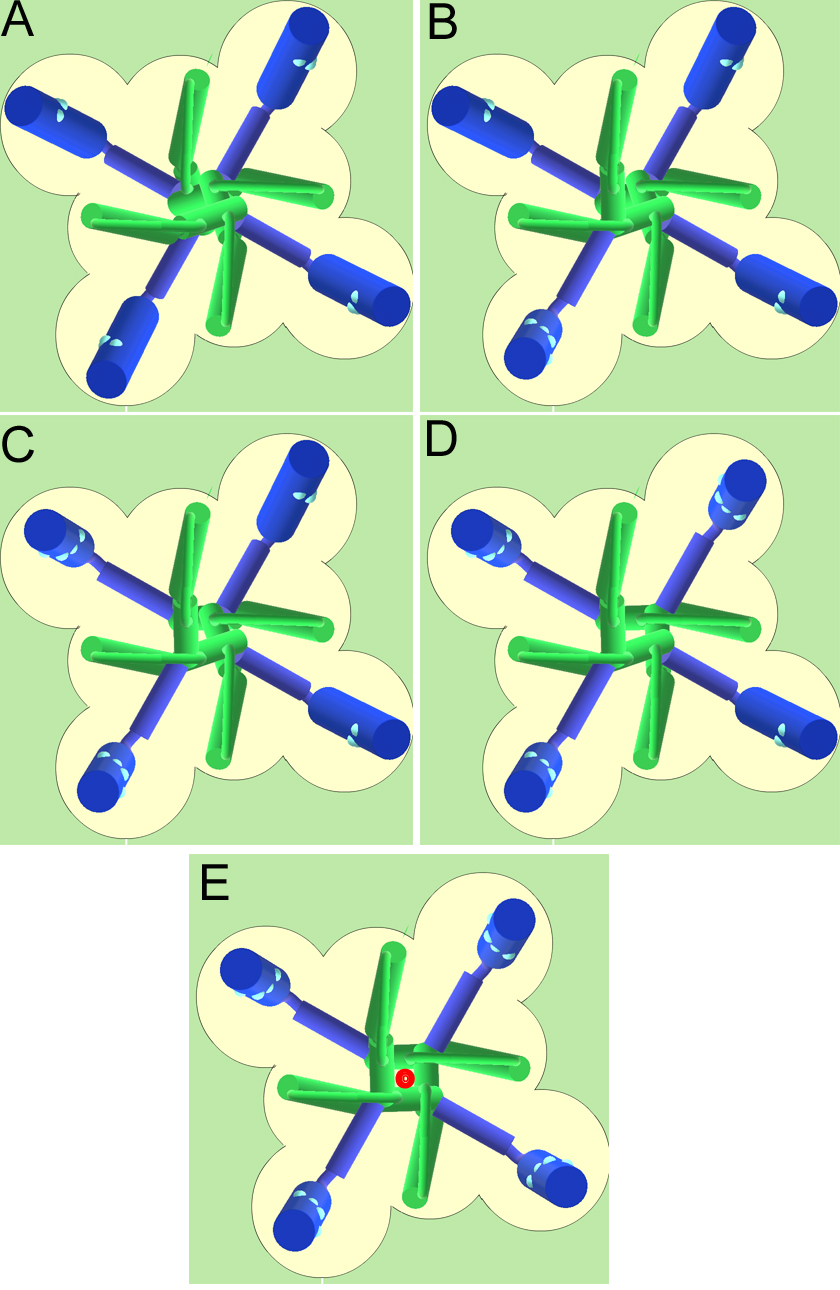
Plate 1. Schematic representation of the closed and open states of the K channel. View of the channel from the extracellular side.The pore lining is represented by the green segments and the S4 segments are pictured in blue. The coupling between the S4 segment and the pore is represented by the blue linker. A. view of the four subunits, all in the resting position. B. One subunit in the active position. C. Two subunits in the active position. D. Three subunits in the active position. E. The four subunits in the active position which makes the channel conducting (the K ion permeating is indicated in red). Notice that there are 16 possible conformations (2 x 2 x 2 x 2) but only one is conducting (E).
The movement of the gating subunit (the charged cylinder or S4 segment) is a random event and will occur extremely fast and spontaneously as indicated by the spikes (Gate-1 through Gate-4) in Fig. 9, (where an upward spike is a transition from resting to active and a downward spike is the opposite). However, the voltage across the membrane will have an influence on the probability that the segment will be straight down (resting) or tilted out (active). Thus, at negative potentials (the resting potential) the S4 segment will spend most of the time in the resting position as it is attracted toward the inside of the membrane. On the other hand, at positive potentials, the S4 will tend to sit more in the active position due to electrostatic repulsion. In this way, the membrane potential is controlling the open probability because conduction will occur when all four are in the active position. If we call n the probability that any of the four cylinders is in the active position, then the probability that ALL four are in the active position is n raised to the fourth power. This means that the probability of being open will be
Po=n4
Starting from a hyperpolarized potential (-100 mV), most of the time the subunits will be in the resting position and very infrequently all four may be, for a brief period of time, in the active position producing a brief ionic current through the channel.
When the membrane potential is suddenly made more positive, there will be a
period of time (a lag) before we may find all four in the active position,
producing an initial delay in the first opening of the channel (trace labeled iK in
Fig 9). Even if the potential is maintained positive, it is quite likely that
one of the subunits will make a sojourn to the resting position producing a
brief interruption in the single channel current (Fig
9).
.
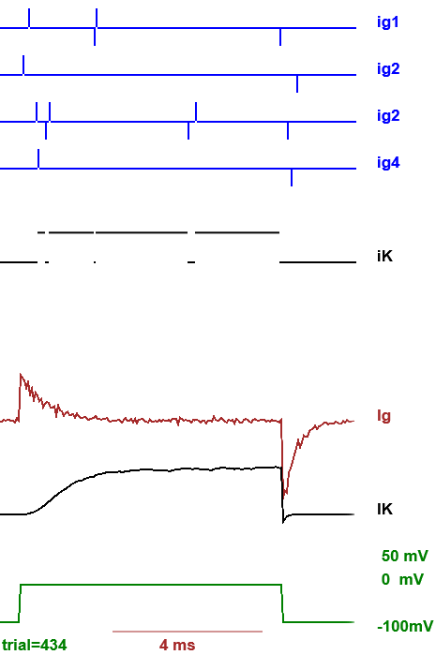
Figure 9. Electrical manifestation of the movement of the gating charges. All traces are in response to the pulse pattern indicated in the bottom grenn trace (start at -100 mV pulse to zero and returning back to -100 mV). The first four blue traces (ig1 through ig4) show the gating charge shots of each of the four voltage sensors: upward spike is transition to active and a spike down is transition to the resting state. The next trace, iK, (black) shows the ionic current through the channel. The next trace (brown) is the average after 434 trials (in this case) of all the gating charge transitions, making up the macroscopic gating current (Ig). The next trace (black) corresponds to the average of the single channel ionic currents after 434 trials making up the macroscopic ionic current (IK).
The vertical spikes in the traces Gate 1 through Gate 4 in Fig.
9 represent the rapid transfer of charge of the gate itself across the membrane
(currents shots) which is called the single gate gating current. When many of
these traces are averaged, these shots of current add up into what is called
Gating current (avg Ig in Fig. 9) because
it is an electrical manifestation of the movement of the voltage sensor. These
current shots should not be confused with the single channel current:
shots are very brief, transient currents that represent the movement of the
voltage sensor while single channel currents are the expression of the movement
of ions through the open channel.
As the depolarization is increased, the latency to first opening decreases and the open times are prolonged (see Figs 10, 11 and 12). These are kinetic features of the single channel currents and they are important in determining the characteristics of the macroscopic currents. In fig. 10, the membrane potential was taken to -30 mV and very few openings occurred (the recording of the single channel current for only one trial is shown, in addition to the average of 807 trials). The average current (IK) reflects the contribution of 807 trials to the same potential or, as the channels are assumed to be independent, it is equivalent to the current produced by 807 channels in response to the voltage step to -30 mV. Notice that as the potential is made more positive (Figs 11 and 12) the average current increases and reaches its final value in a shorter time. This is a consequence of a combination of i) the higher open probability at more depolarized potentials, ii) an increase in the driving force (V-EK is larger) and iii) the decrease in the first latency time.
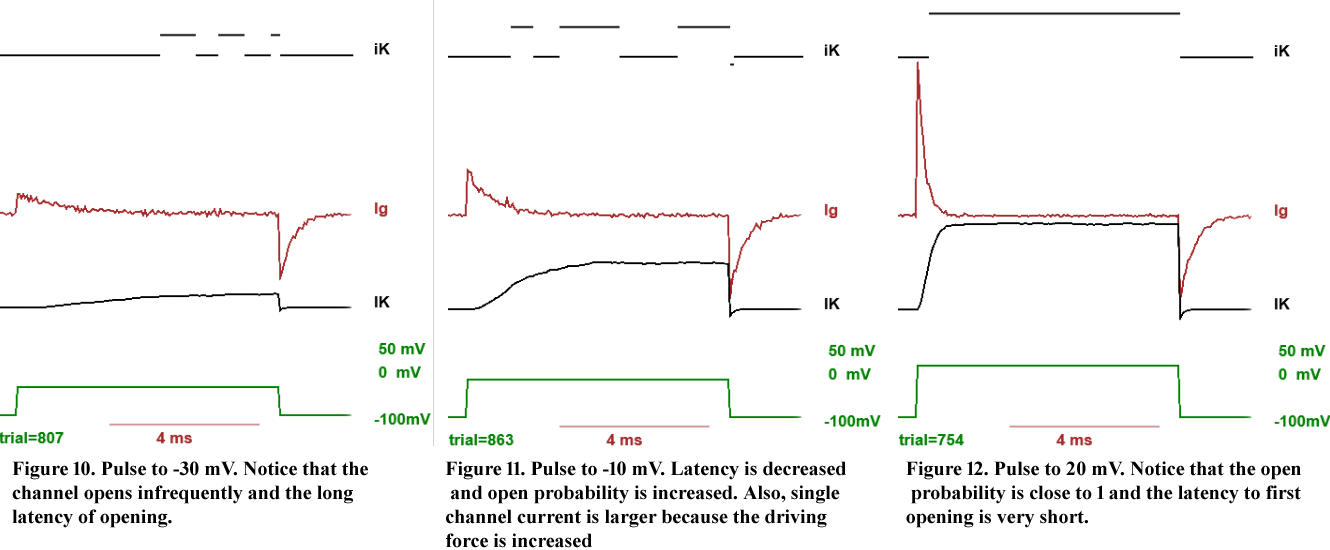
Single channel conductance. There are at least two important measurements that we can make in the channel behaviour as a function of membrane potential. The first one is the current that flows through one channel as a function of membrane potential. This can be done by pulsing the membrane at different voltages and measuring the amplitude of the currents when the channel opens as shown in the examples of Figs. 10-12. The relation between the single channel current and membrane voltage is very close to a straight line that crosses the horizontal axis at -80 mV, the K equilibrium potential. This means that the channel, when it is open, behaves like an ohmic resistor and the single channel current is given by
iopen single=g(V-EK)
where g is the single channel conductance and EK is the equilibrium potential for K. (see top panel of Fig. 13). (This is only an approximation because depends on the K concentrations on both sides and V)
Open probability. The second important measurement is to compute the Po as a function of membrane potential V. By inspection of Figs 10 to 12, it is clear that Po not only depends on V but also on time because at short times after giving the depolarizing pulse no openings are observed but later they appear more frequently. At long times, however, this Po is stabilized and its functional dependence on V is sigmoidal, as shown in the middle panel of Fig 13. This is the result of the voltage influence on the position of the gating subunit which controls the opening of the channel.
Current as a function of voltage. To compute the current at any instant, we need to know the probability of being open and the current through an open single channel. The current will be given by
i=Pog (V-EK).
(see bottom panel of Fig 13). This current i will be in general a function of time because Po is a function of time.
 Macroscopic K currents. The time course of a single K channel
opening is not predictable but the average behavior is easily obtained by summing
a large number of single channel events in response to the same voltage perturbation.
This is shown in the lower traces labelled IK of Figs 10 to 12. The long latency for
small depolarizations is translated in a slow rise of the average current (Fig
10), while a short latency for large depolarizations is shown as a very fast
rise in the average current (Fig. 12). For example, in the squid axon there are about 50
to 100 K channels/µm2 which means that a small region of the axon
will have a large number of channels contributing to the total current. If these
channels operate independently from each other, then the average behaviour obtained
by repeating the same stimulus in one channel will correspond to the behaviour
of the large population of channels in the cell. This is an important result
because we can predict the macroscopic current by repeating the same observation
in one channel. We can compute the macroscopic current density as the single
channel current times the density of channels NK
and it will be given by
Macroscopic K currents. The time course of a single K channel
opening is not predictable but the average behavior is easily obtained by summing
a large number of single channel events in response to the same voltage perturbation.
This is shown in the lower traces labelled IK of Figs 10 to 12. The long latency for
small depolarizations is translated in a slow rise of the average current (Fig
10), while a short latency for large depolarizations is shown as a very fast
rise in the average current (Fig. 12). For example, in the squid axon there are about 50
to 100 K channels/µm2 which means that a small region of the axon
will have a large number of channels contributing to the total current. If these
channels operate independently from each other, then the average behaviour obtained
by repeating the same stimulus in one channel will correspond to the behaviour
of the large population of channels in the cell. This is an important result
because we can predict the macroscopic current by repeating the same observation
in one channel. We can compute the macroscopic current density as the single
channel current times the density of channels NK
and it will be given by
IK=NK g Po(V-EK)
which is proportional to the current i shown in the bottom panel of Fig. 13. Notice that the macroscopic current IK=i NK is a non-linear function of V but that most of the nonlinearity is produced by the nonlinear characteristic of the Po vs V and not by the i-V characteristics of the open channel.
Many Na channels have more than one subunit of different size and structure. However, most of the properties we will discuss reside in the subunit which is about four times larger than the individual subunit of the K channels. It has four homologous domains, each containing 6 putative membrane spanning segments (see Fig. 14). Therefore the structure of the molecule is considered to be similar to four K subunits. From the functional point of view there are important differences between Na and K channels. First, the Na channel is mainly selective to Na, allowing K to pass about 15 times less easily. In contrast, K channels are more selective to K, allowing Na to pass with a permeability less than 20 that of K. Another striking difference is the speed of activation. The latency to first opening is about 10 times shorter in Na channels than in K channels, giving Na channels an overall activation time about 10 times faster than K channels. Another important difference is the presence of inactivation (see below) which does not occur in the delayed rectifier K channel previously described.
Figure 14. The alpha subunit (pore forming subunit) of the Na channel containing four homologous domains. The first three domain have fast kinetics while the 4th domain has slower kinetics. The IFM (isoleucine, phenylalanine, methionine) motif initiates the inactivation of the channel.
In the Na channel we can distinguish three main states of the channel: closed, open and inactivated. As it is the case of the K channel, the opening of the Na channel also requires several gating events (in the classical formulation: three events) and proceeds by a similar mechanism as explained above for the K channel. Plate 2 shows a simplified view of the Na channel: pore lining is shown in green (selectivity filter and S6 segments) and the movement of the voltage sensors are indicated as a displacement of a charged cylinder (S4 of domains I through IV), affected by the membrane potential. If the S4 segment of Domains I, II and III are simultaneously up , the channel opens. However, once the channel is open, even if the depolarization is maintained, conduction stops (see Plate 2). This corresponds to the onset of inactivation. The inactivation occurs as following: the S4 segment of domain IV (red) responds to a voltage change with slower kinetics than the S4 segments of domains I-III. But when S4 of domain IV moves up, the IFM motif docks and binds into its site resulting in a conformational change on the S6 segments (green cylinders) of domain III and IV that exposes four large hydrophobic residues into the pore, thus blocking conduction (the inactivated state). In this condition, the channel is still open but unable to conduct. In the macroscopic current, the IFM motif binding and the subsequent block by the 4 hydrophobic side chains produces a decrease of the ionic current during the maintained depolarization. Important features of the inactivation mechanism are its establishment and removal.
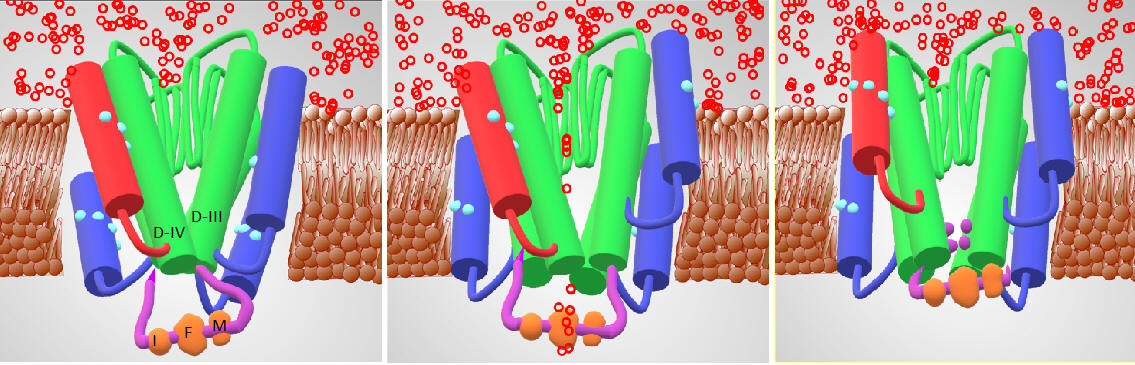
Plate 2. Schematic representation of the
Na channel operation with sensors of Domains
I, II and III in blue (fast) and sensor of Domain IV in red (slow). All four
sensors couple to the bottom of S6 segments (in green) to control the gate. The
channel conducts when Domains I,II and III are simultaneously active (m3, according to the Hodgkin and Huxley formulation)
but it also conducts when all four Domains are active. However when the sensor
of Domain IV becomes active, the IFM motif gets in position and the side chains
of four bulky residues in S6 segments of domains III and IV blocks conduction.
LEFT: Closed State. This state is favored at hyperpolarized
potentials ( in this case just before the pulse, -100 mV). This is one of the
many possible
closed and non-inactivated states.
OPEN: Open State (conducting). This state is favored by the depolarizing pulse to
-10 mV. Ions cross the pore and go from tthe external solution to the internal
solution.
RIGHT: Inactivated State. Even though the membrane is still depolarized
and the gates are in the open position, the channel is not conducting because
the pore is blocked by the 4 bulky amino acids (in violet) that are moved in
position after the IFM motif binds.
Figure 15. Single sodium channel records and average currents (Iavg) for pulses to -50, -35, 0, 30 and 60 mV starting and returning to -100 mV. Notice that the open probability is very small for pulses to -50 mV although the single channel current is the largest because there is a large driving force. The driving force reverses for a pulse to 60 mV because it is more positive than the Na reversal (equilibrium) potential. Ocasionally, the channel does not inactivate even to the end of the pulse and a single channel event may be observed at the end of the pulse (see arrow for the pulse to 60 mV). The sum of these events produce the ionic "tail" observed at the end of the pulse. BOTTOM (right): family of Na currents for a series of depolarizations ranging from -50 to +60 mV, starting and ending at -70 mV.
It is clear from Fig. 15 that the probability of opening increases with depolarization as was the case of the K channel. The single channel event is larger at hyperpolarized potentials (compare -50 with 20 mV) because there is a larger driving force. At +60 mV the single channel current is outward because that potential is more positive than +40 (the equilibrium potential of Na for this ionic condition). Although the single channel event is large at -50 mV, the average current (top trace) is almost negligible because the events occur rarely at this potential, that is, the Po is very small at -50 mV. On the other hand, at +20 mV the open channel currents, although smaller, are much longer because the Po is higher.
Following the same ideas presented for the activation of the K channel, we
can express the Po of the Na channel to be proportional
to m3, where m is the probability that any of the
three gating subunits are in the active position. To consider the effect of
inactivation we may define the probability that the IFM is in the
blocking position as 1-h, or out of the docking site
as h. In that case, the open probability is given by
Po=m3h
if the activation of the gating subunits and IFM docking were independent events.
As it is seen in Plate 2 and in the Na simulation, the IFM motif will get in its site after the channel is open and much less frequently it will dock in the site when the channel is closed. This means that the inactivation process is coupled to the opening (or activation) of the channel, that is, the two events are not independent.(4) The consequence is that the voltage dependence of the inactivation process is practically all derived from the voltage dependence of activation. This means that the inactivation IFM motif does not need a voltage sensor of its own. We know now that when the sensor of Domain IV goes into the active position then the probability of the inactivating IFM particle to get into position increases drastically such that it is a good approximation to say that the inactivating particle blocks conduction only after Domain IV sensor is active. As Domain IV kinetics is slower than Domains I, II and III, the binding site exposed by Domain IV movement is only available after the channel is open and the voltage dependence of inactivation is inherited mainly from the voltage dependence of Domain IV.
What happens when the depolarization is terminated and the membrane is returned to negative values? The channel deactivates but it cannot do it completely until the IFM motif exits from its binding site and this happens very slowly. For example, returning to -70 mV it takes an average of more than 10 ms for the IFM to exit. This has an important consequence because if one depolarizes the membrane again after a period of only 2 or 3 ms at -70 mV there will be no channels able to conduct because the IFM is still in position, hence the channel is inactivated. This is one of the reasons why an action potential cannot be followed too close by another one (refractory period).
NOTES:
4. The Hodgkin and Huxley formulation assumes independence between activation and inactivation giving origin to m3h. The predictions of the action potential mechanisms are essentially not modified by using independence or coupling between activation and inactivation.